Introducing Path Analysis: The Ultimate Tool for Understanding Customer Journeys
Marketing today is more complex than ever. Customers interact with brands across multiple platforms, devices, and touchpoints—sometimes engaging with ads, sometimes just viewing them, and often switching between mobile and desktop before making a purchase. Yet, marketers have lacked a clear way to examine these journeys in full detail. While Roivenue already provides tools to evaluate channels’ performance, what’s been missing is a way to understand how these channels work together. That’s where Path Analysis comes in. This feature gives marketers a complete, data-driven view of customer journeys, helping to uncover patterns, identify synergies between platforms, and understand the role of different touchpoints.
What You Can Discover
Click vs. Impression Impact
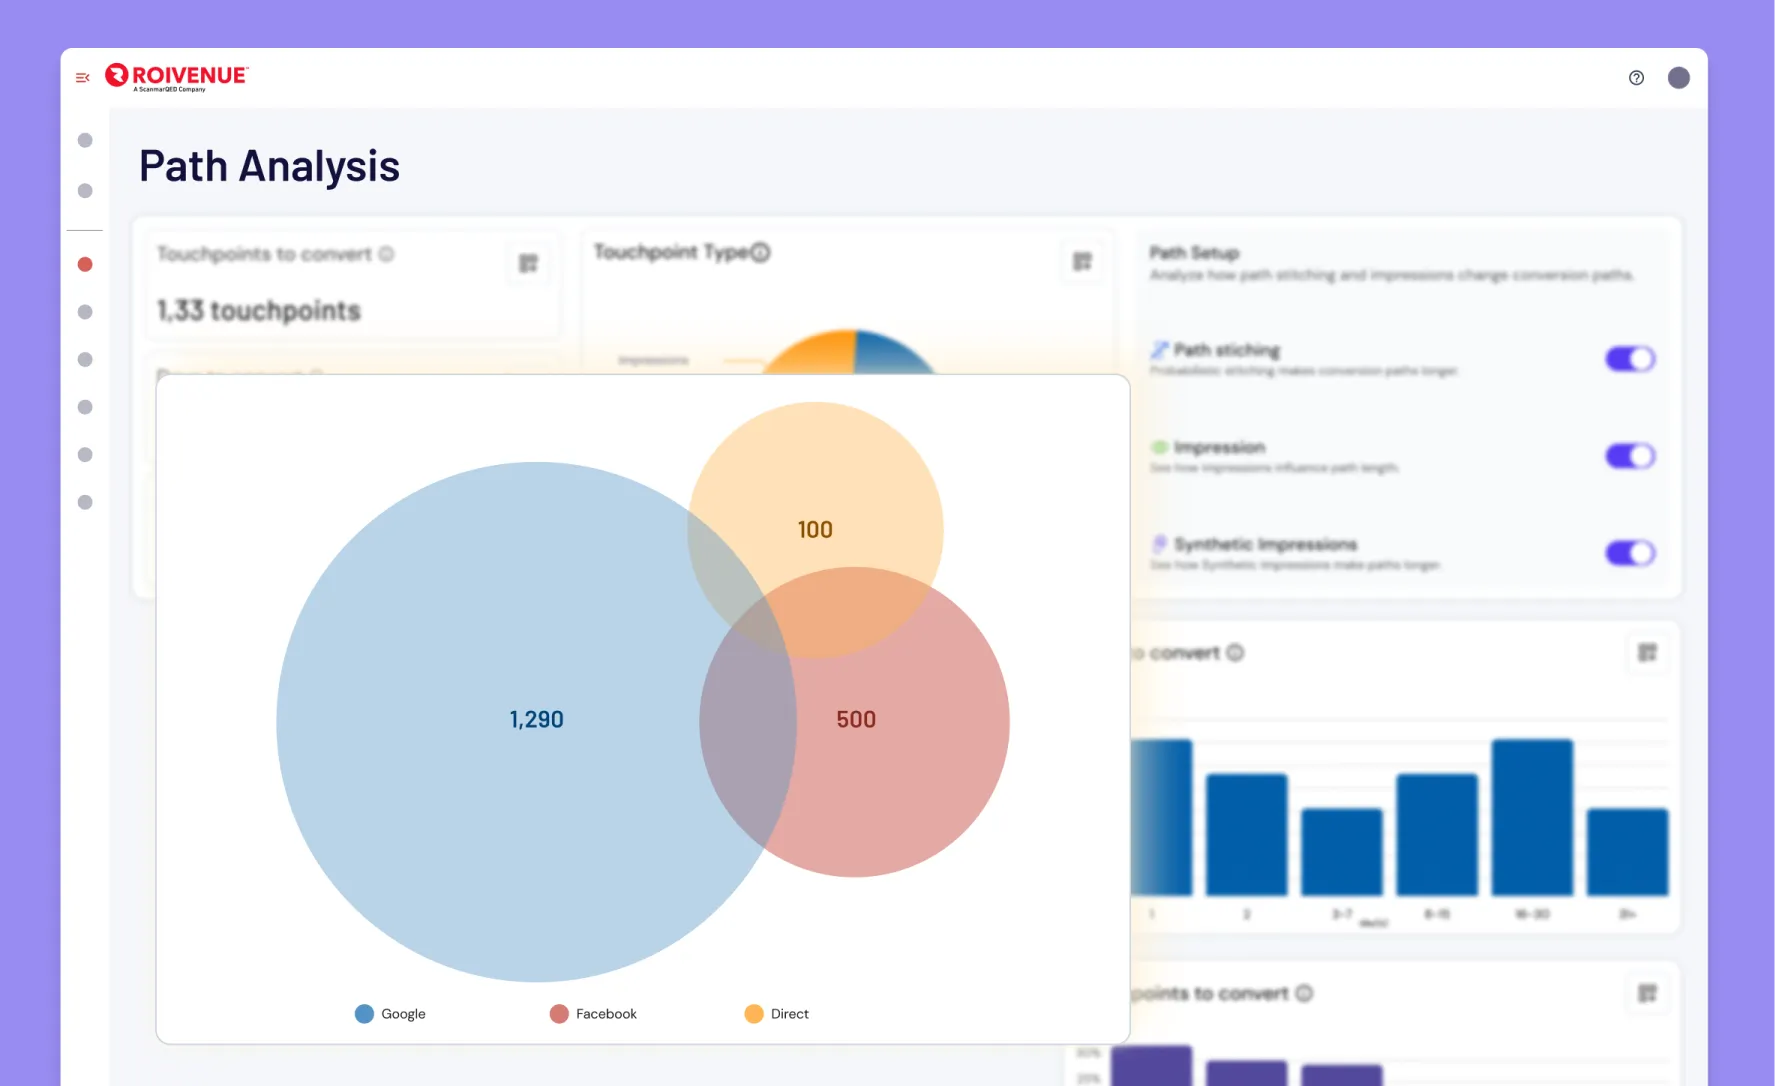
Impressions play a key role in upper-funnel activities, shaping customer awareness and influencing decisions long before a click happens. This feature allows you to compare customer journeys with and without impressions, revealing how much data is lost when focusing solely on clicks. Additionally, you can analyze journeys by incorporating Roivenue’s synthetic impressions (Read more about clicks, impressions, and synthetic impressions)
Path Stitching in Action
Many attribution tools struggle to connect fragmented customer interactions. As a result, it often appears that many potential customers didn’t convert when, in reality, their touchpoints were simply not mapped into the correct conversion journey. In Roivenue, we developed Path Stitching—a probabilistic approach to the reconstruction of customer journeys that seamlessly connects the right touchpoints from across devices into one journey, ensuring a more accurate representation of customer behavior. (Learn more about Path Stitching)
Until now, the application did not include a dedicated tool for clients to explore how Path Stitching changes their customer journeys—whether by uncovering additional contributing platforms, revealing a stronger role of a specific platform, or connecting interactions that would otherwise appear unrelated. For example, many users browse social media on mobile but complete purchases on desktop—a behavior that traditional tracking often fails to link. Path Analysis now provides that visibility, allowing marketers to see the full picture.
The Overlap Chart: Visualizing Channel Synergies
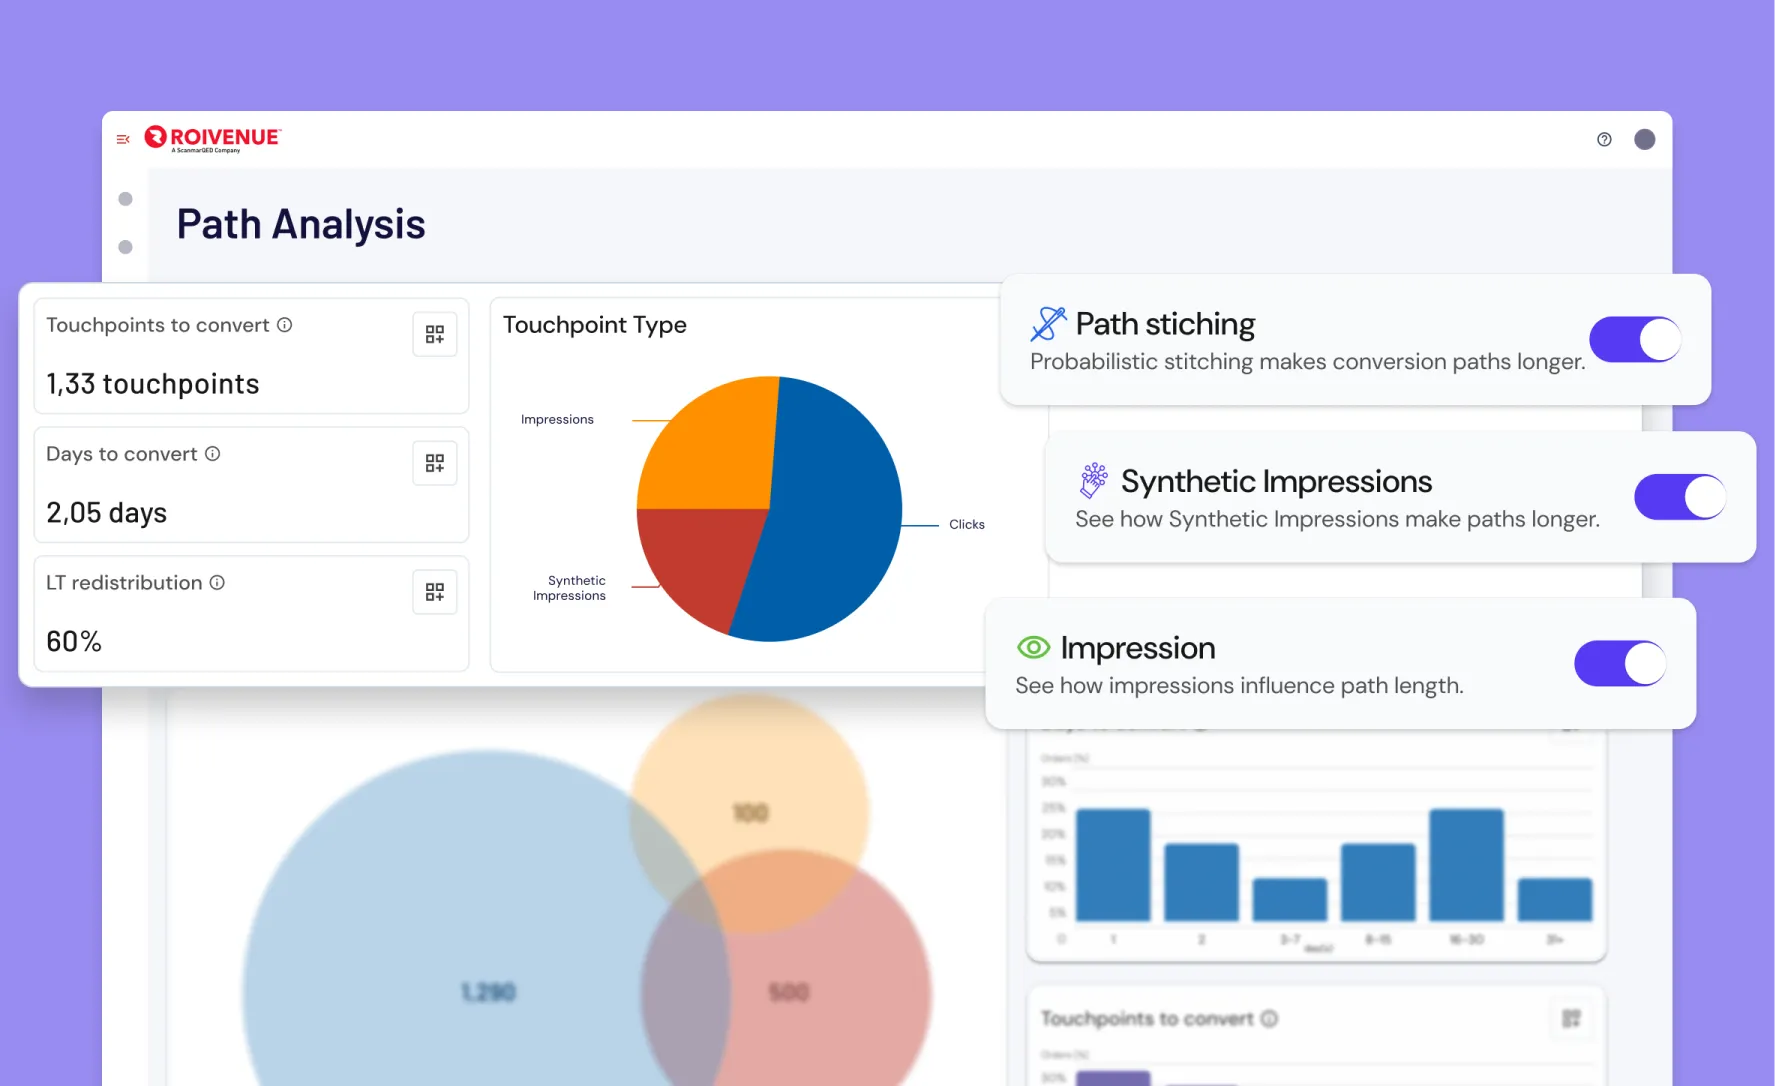
Ever wondered which channels work best together? The Overlap Chart helps you visualize how different platforms, campaigns, or channels interact within customer journeys. Select a dimension, such as platforms or campaigns, and choose up to three specific values to explore their overlap and synergy.
For example, you can analyze how different social media platforms interact within the customer journey. Since platforms like Facebook, Instagram, and TikTok attract different age groups, you might expect minimal overlap—especially if your campaigns target distinct demographics on each platform. This feature allows you to test that assumption.
Journey Histograms: The Full Story Beyond Averages
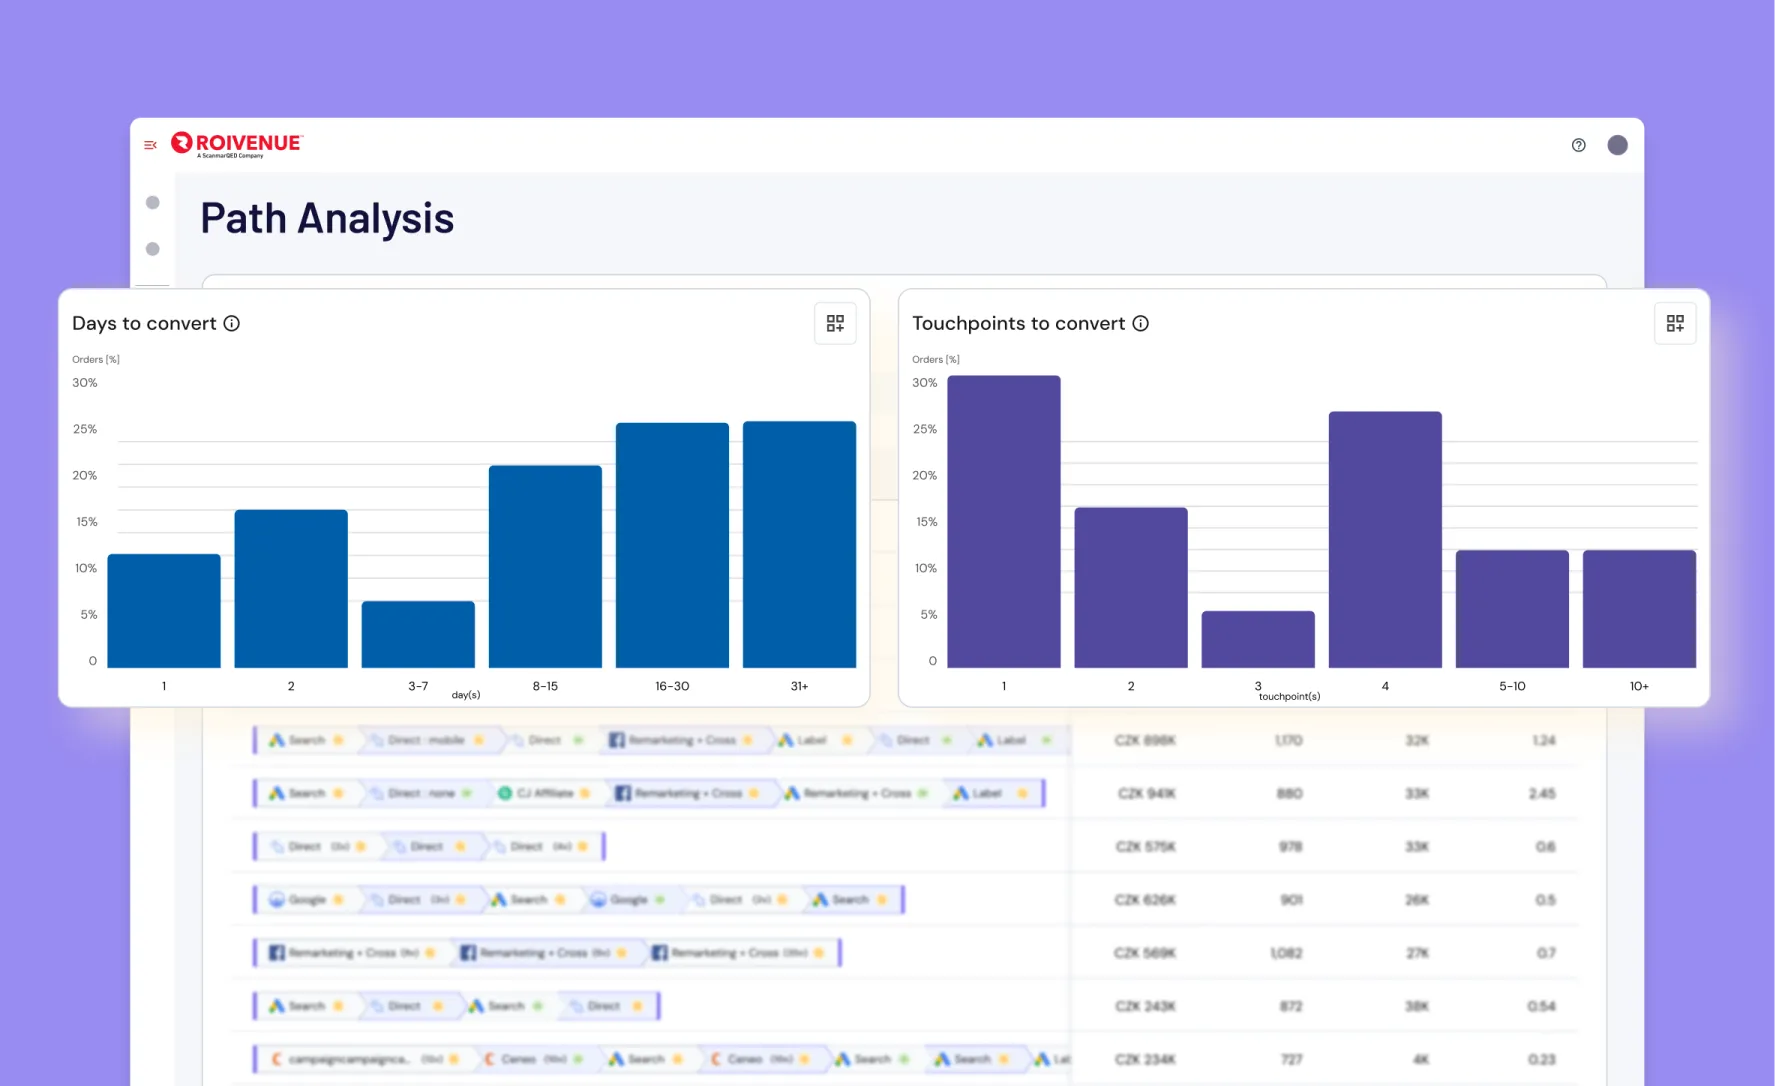
- Averages can be misleading. Some customers convert within hours, while others take days or weeks. Journey histograms break down how many touchpoints customers typically experience before converting, showing whether shorter or longer paths lead to better results.
- Conversion timing insights reveal how quickly customers make decisions, allowing you to refine strategies based on real user behavior.
Conversion Path: Gain Deeper Insights into Customer Journeys
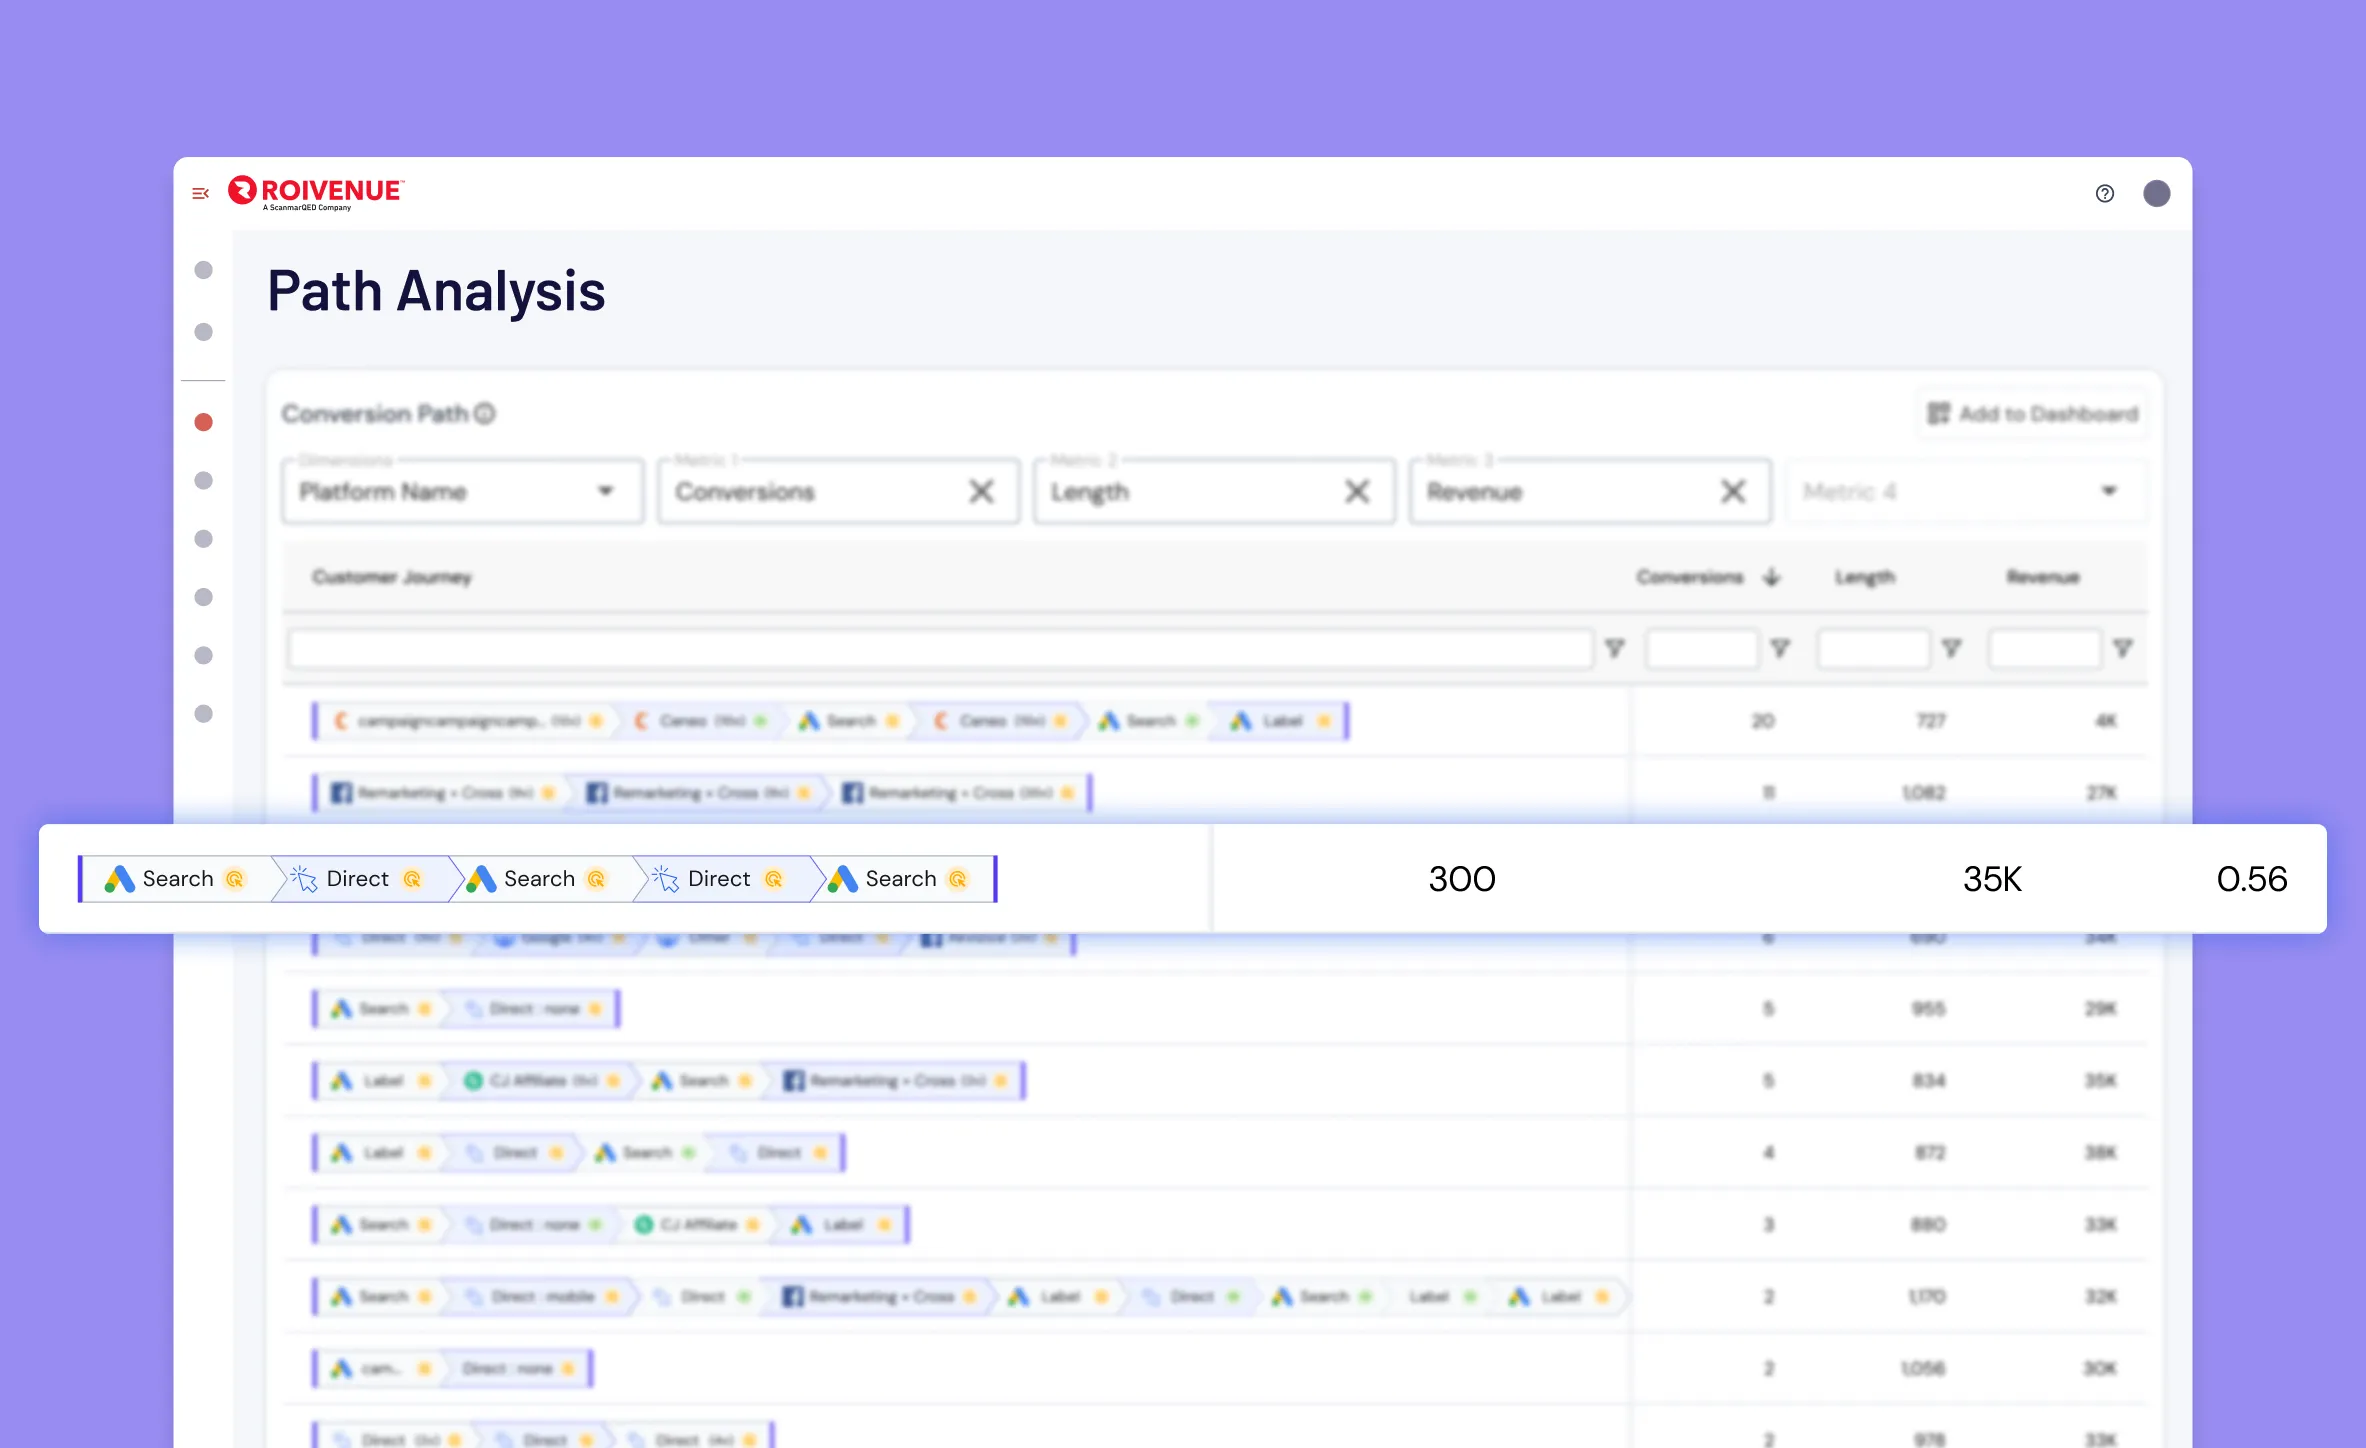
The Conversion Path section provides a detailed view of customer journeys, revealing which paths drive the most conversions and revenue. You can analyze conversion paths based on different dimensions, such as platforms and campaigns, as well as various metrics.
Advanced filtering allows you to examine paths that start with, include, or end with specific touchpoints. You can also filter by journey complexity, focusing on single-touchpoint conversions or those requiring multiple interactions.
For example, if you notice that Direct traffic is receiving more credit than expected, you have several options. You could disable credit attribution for Direct entirely, but before making that decision, you can use the Conversion Path section to analyze where Direct appears in customer journeys:
-
Does Direct serve as the final step before conversion, suggesting customers are returning to complete their purchase?
-
Is it appearing as an early interaction, possibly influenced by prior marketing efforts?
-
Are customers navigating through paid channels before ultimately converting via Direct?
Why Marketers Will Love This
Path Analysis is more than just a new feature – it’s a powerful tool for understanding customer journeys at a granular level. By uncovering hidden patterns, marketers can:
-
See which channels drive engagement early in the journey versus those that close the sale
-
Analyze how different touchpoints interact and contribute to the final conversion
-
Understand how customer interactions evolve across different platforms
This isn’t about assigning credit—it’s about seeing the full picture. With Path Analysis, you gain a deeper understanding of how customers move through the funnel so you can make smarter, more strategic marketing decisions.
Ready to explore? Start uncovering real customer behaviors and optimizing your strategy today.
45 minutes on relevant demo data, with a summary for Finance.