Adobe Data Feeds are powerful. They’re perfect for when you need to get data out of Adobe Analytics and into different environments or tools for further analysis.
Vodafone connected Adobe Analytics to the ROIVENUE Marketing Suite and reaped the benefits. The ability to integrate data from Adobe Analytics with data from multiple online marketing platforms allowed Vodafone to utilize data-driven attribution modelling.
The Challenge
Vodafone Czech Republic is a telecommunication company that is always trying to innovate. On their website, Vodafone uses Adobe for measuring multiple conversion goals. They needed to connect their data from Adobe Analytics with data from their online marketing platforms. This would allow for a more revealing overall analysis.
Their main goals were:
- connect campaign goals with respective marketing costs,
- measure the return of investment and,
- measure the average cost per conversion.
Also during this process, they would gain reconstruction of customer paths and data-driven attribution in order to identify which channels are over and underestimated by the last-click attribution.
The Solution
Thanks to Data Feeds, exporting the data from Adobe was not a problem but it was necessary to specify all the required fields and goals so they could be properly processed later.
Data Selection
The Experience Cloud ID is the key dimension for establishing individual customer paths. This value identifies interactions from the same user. It was also necessary to export the common dimensions and metrics, so other platforms could be connected later on.
- Date and Time of the interaction was exported, as well as the information about from which channel the visitor came to the website.
- Information about the possible conversion was included, only if the visitor achieved at least one of the measured goals – they provided contact information or they made a purchase on the website.
- Due to the fact that all the hits are included in the export, additional columns were needed to differentiate between a new session vs following hits on the website done by the same visitor.
Setting up the Data Feed
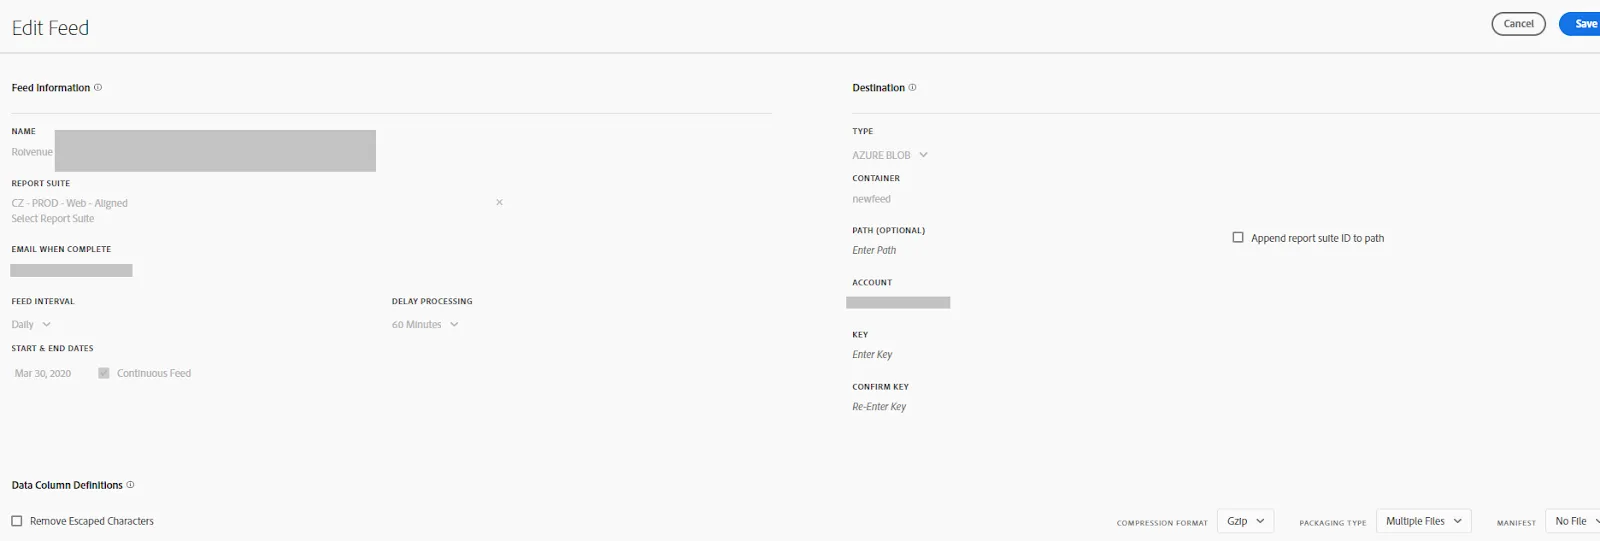
Settings of Adobe Analytics Export to Azure Blob Storage
After the correct dataset was specified, it was necessary to set up the data feed itself. The goal remains achieving a daily export of data from Adobe Analytics to ROIVENUE. The easiest way to achieve this is to export the data to Azure Blob Storage. Both Adobe and Roivenue integrate with Azure natively.
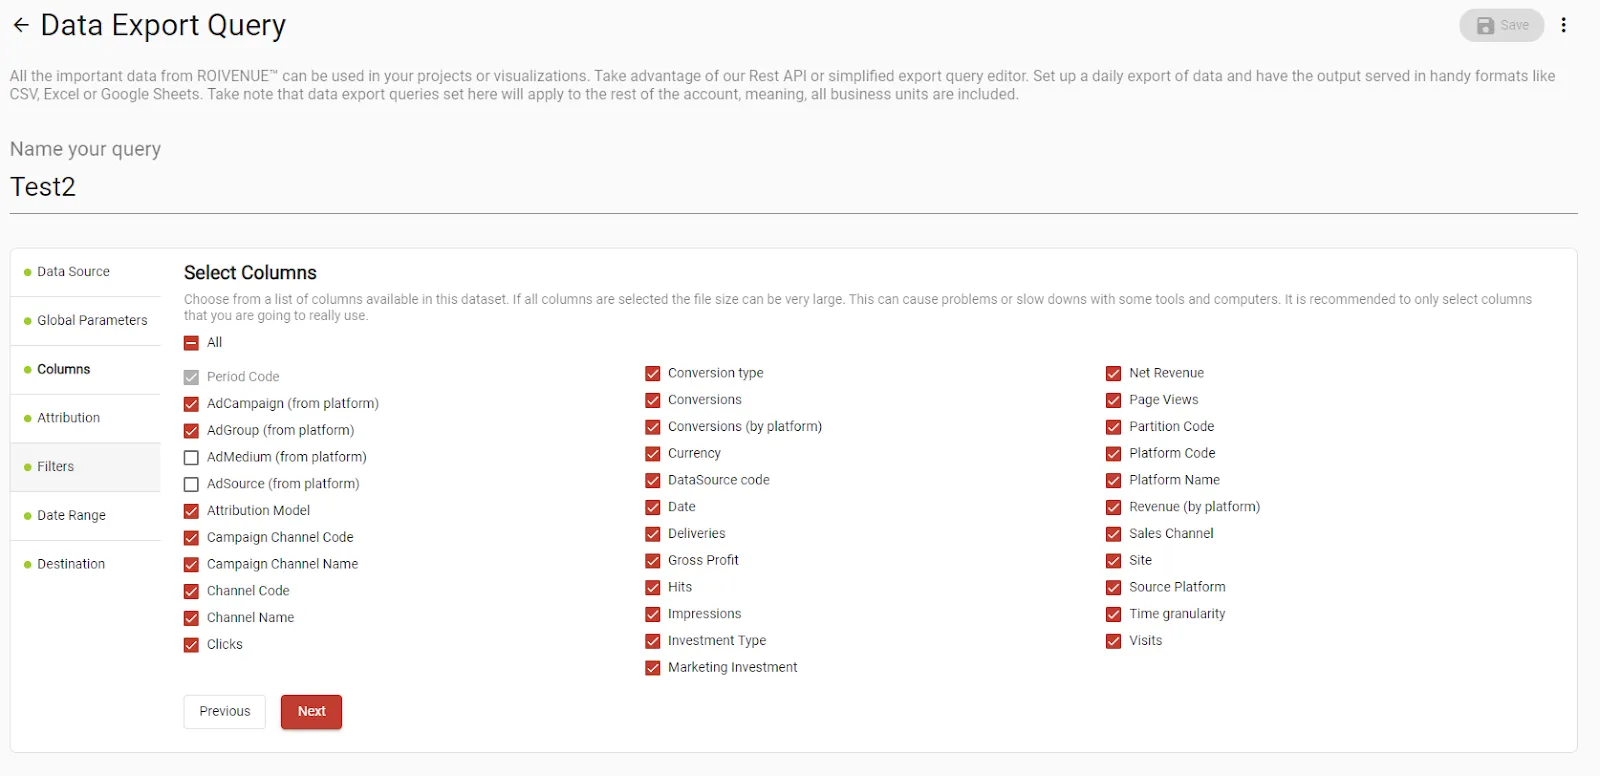
Data export page in ROIVENUE, that allows you to create custom exports.
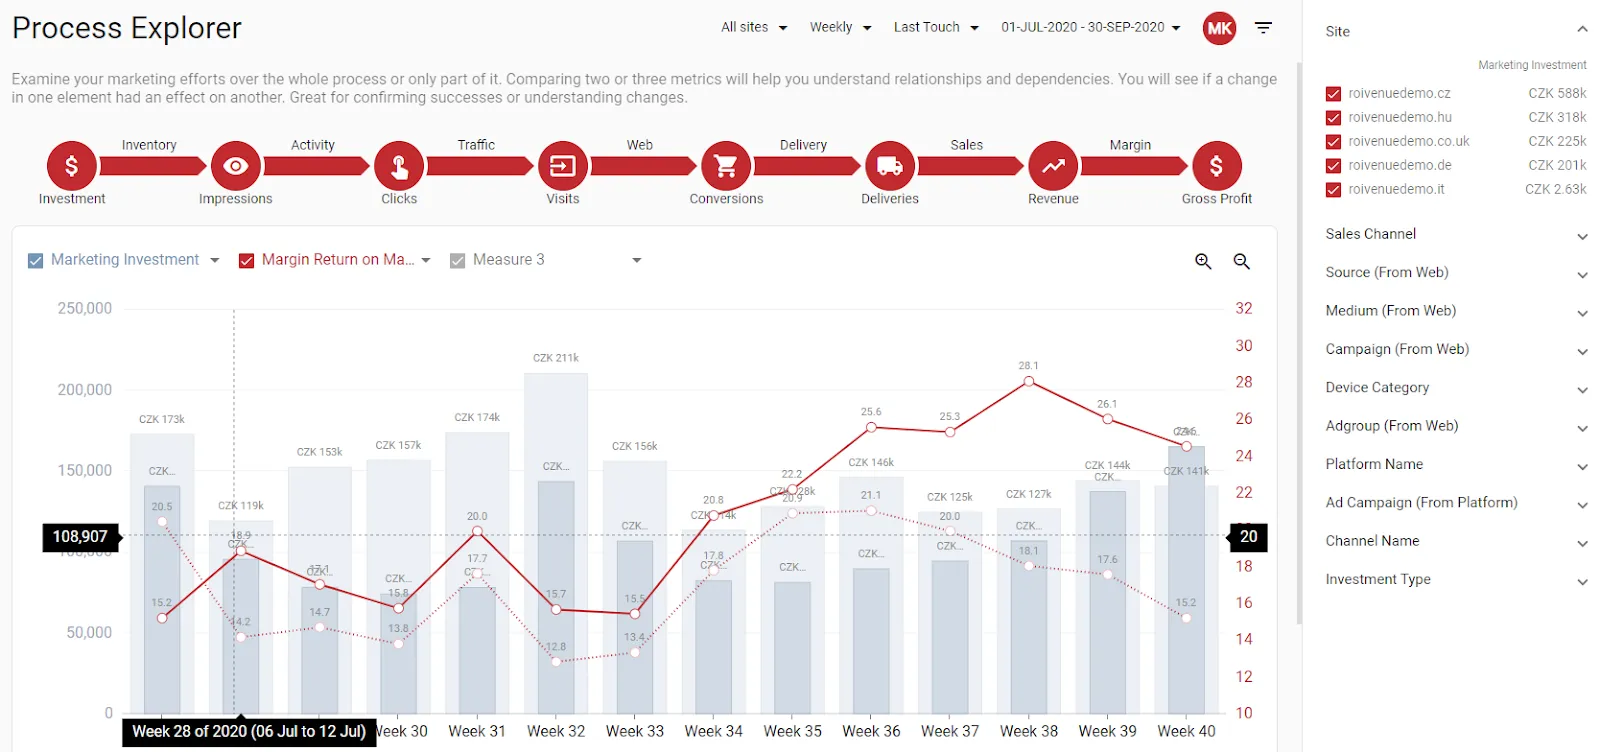
The main view in ROIVENUE, that allows you to evaluate the performance of your business.
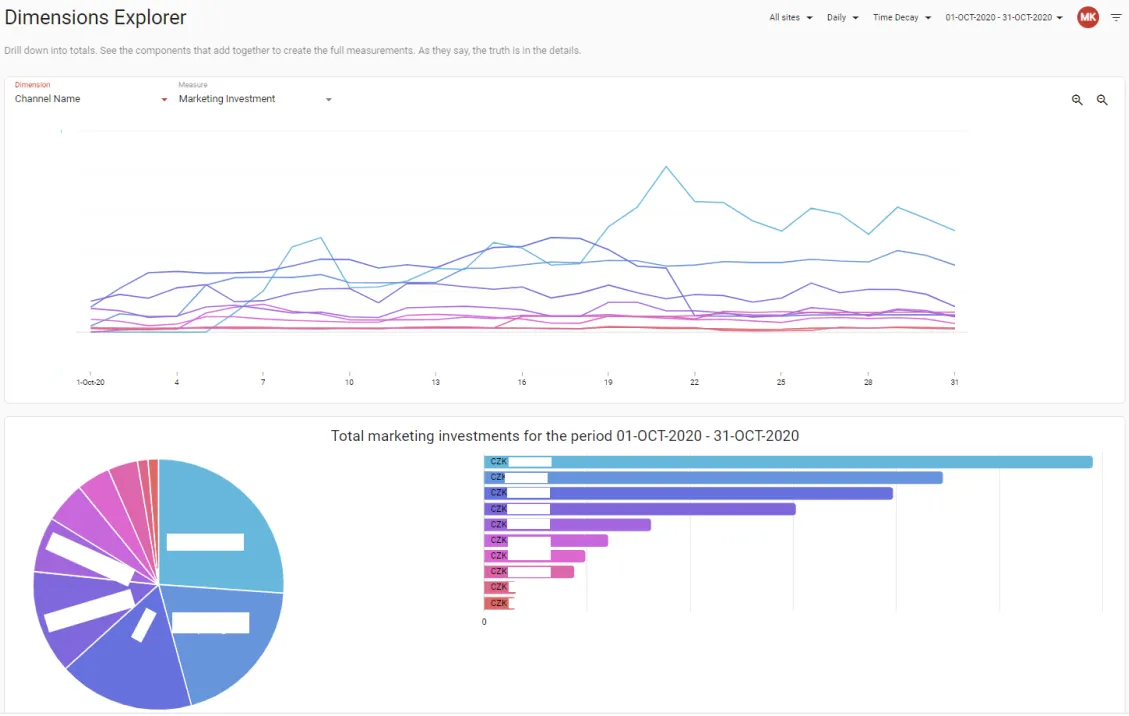
ROIVENUE allows you to easily compare (not only) marketing investment across all channels.
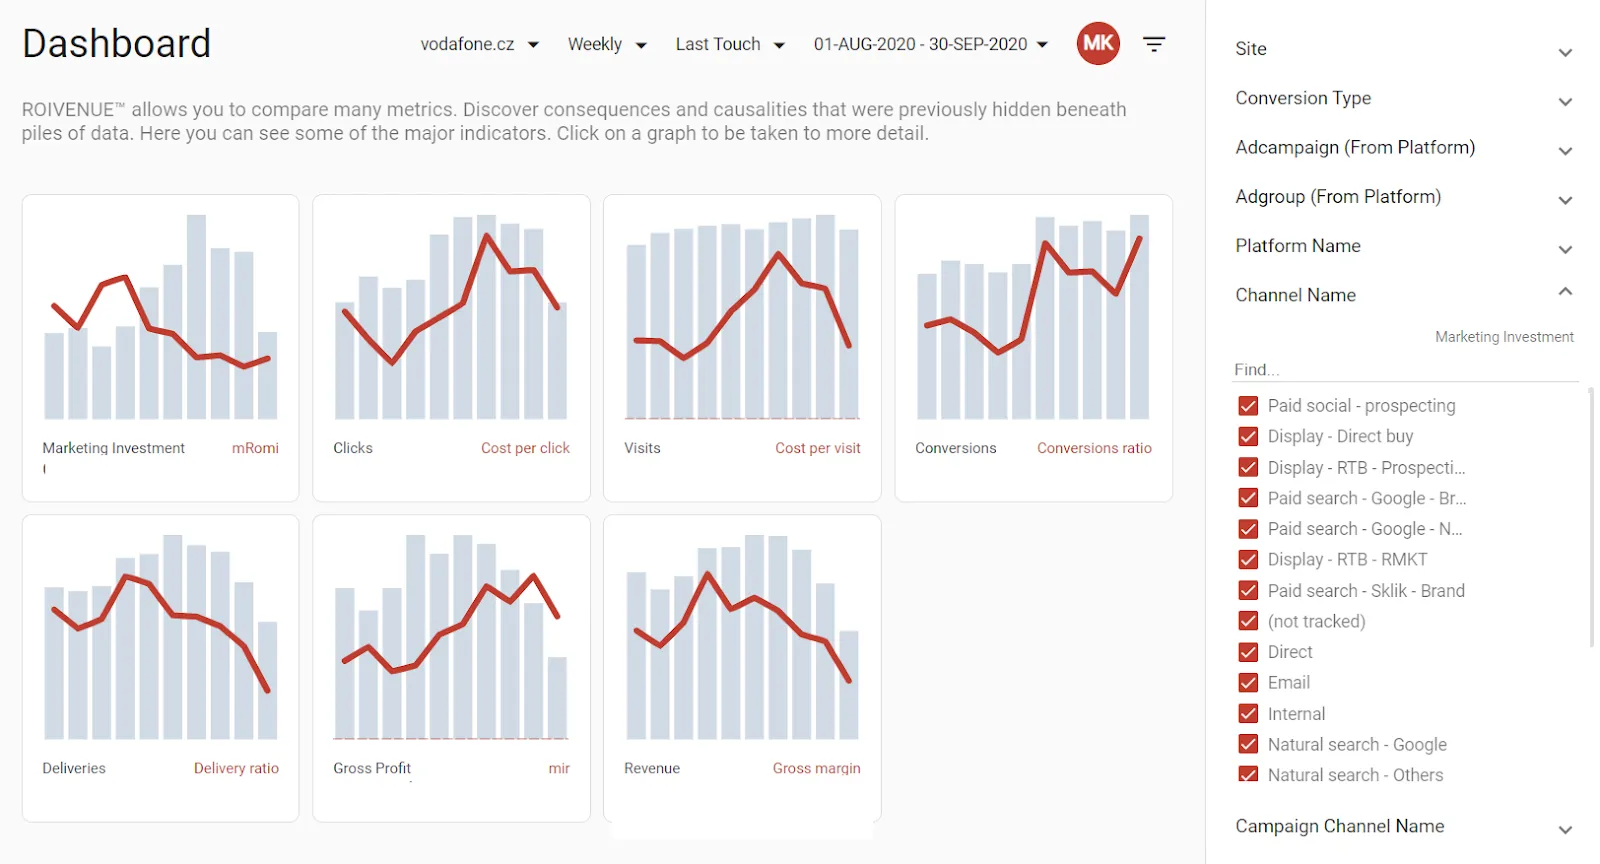
Analysing the whole customer journey from investment to revenue is not a problem with ROIVENUE’s data-driven attribution model
Result
Thanks to Adobe Data Feeds together with ROIVENUE Connectors and Processing, Vodafone is now able to evaluate their marketing activities and see how many leads and purchases each campaign brought and where they can achieve the best cost per acquisition in the future.
If you would like to learn more about the Adobe Analytics data integration, get in touch with us.
45 minutes on relevant demo data, with a summary for Finance.