


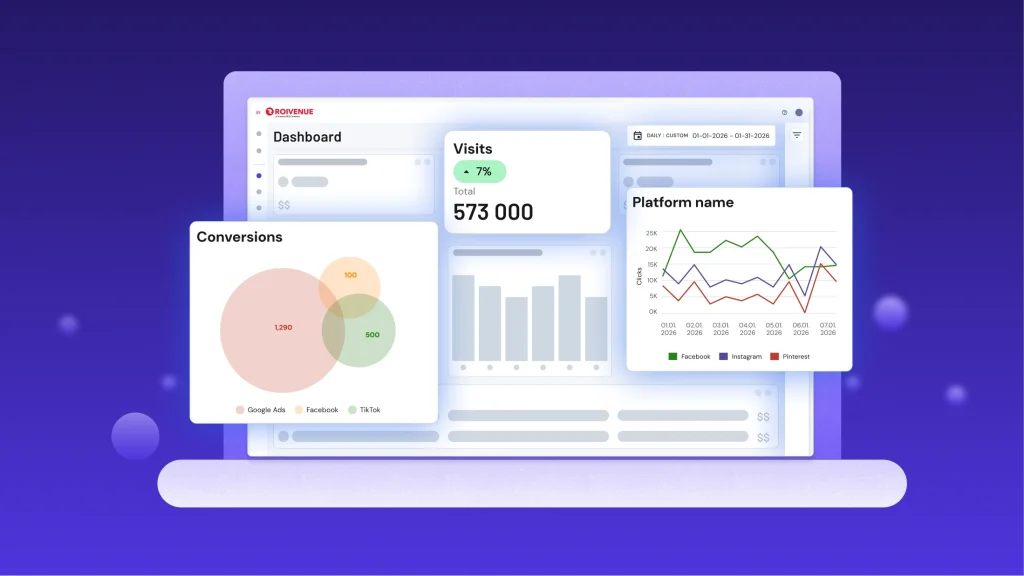
Until now, the dashboards were something you looked at, not something you worked with. That’s what this update changes. Here’s what’s new.
Every Widget Is Now Fully Editable
Think of a widget as a window into your data. It shows you a specific slice: revenue by channel, conversions by country, ROAS by campaign. Until now, once you set that window up and saved it, it stayed exactly as it was. Wanted to look through it from a different angle? You had to build a new one.
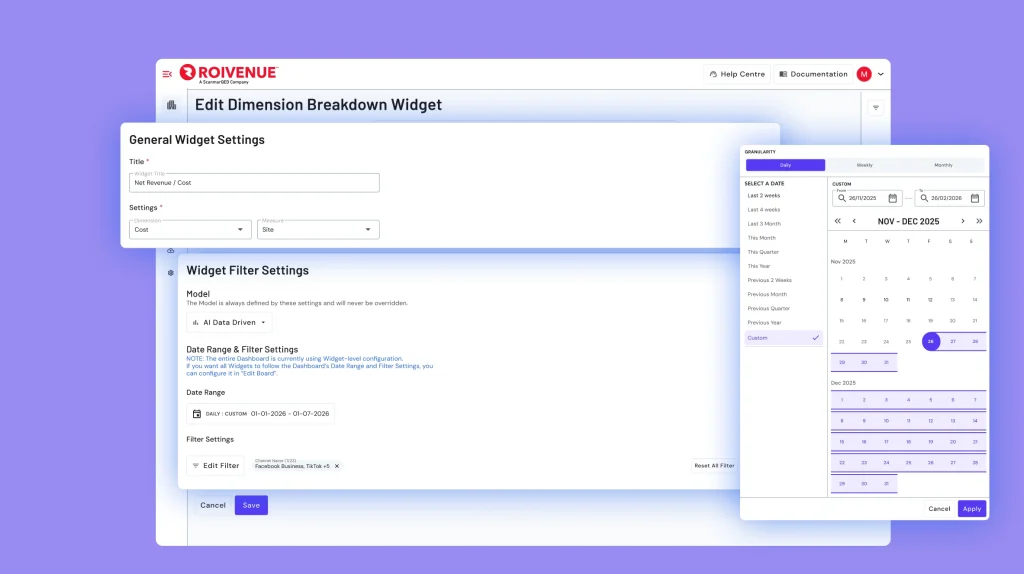
Now every widget is fully editable. Metrics, dimensions, date range, filters, attribution model- all adjustable directly from the widget, whenever you need.
Say you saved a widget showing revenue by channel for the US market. Next week you want to see the same breakdown for the UK. Before, that meant creating a new widget from scratch and deleting the old one. Now you just change the filter, and you’re done in seconds.
Two Modes for Date Range and Filters
This is the change you’ll notice most in day-to-day use.
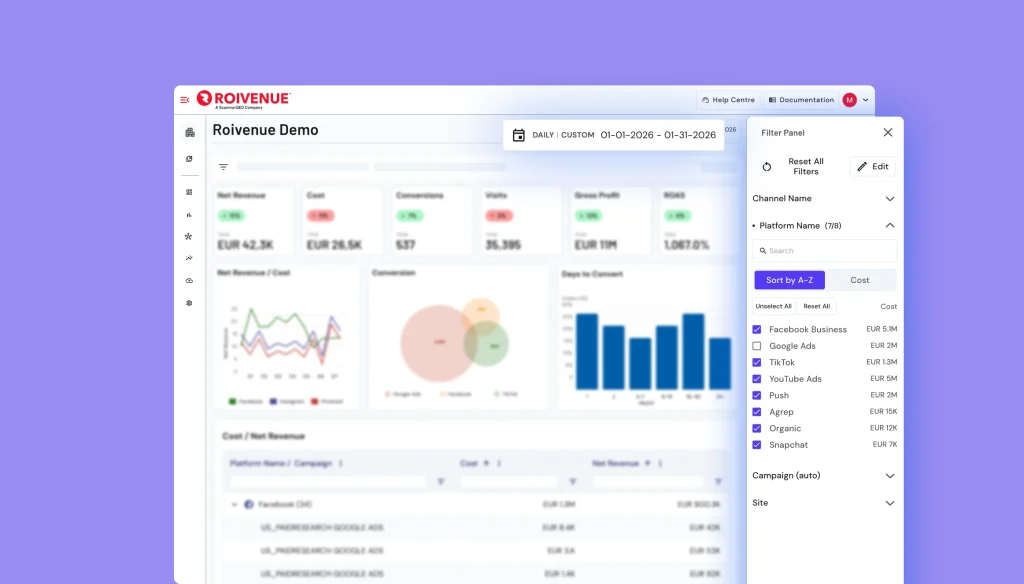
Imagine your dashboard has six widgets: revenue, ROAS, conversions, top channels, top campaigns, and a market breakdown. You want to see how last week looked across all of them, only for Germany. Before, you had to update the date range and the market filter in each widget one by one. Six widgets, twelve clicks, plenty of chances to miss one.
Now you just pick your mode.
Widget-level means each widget keeps its own settings. Useful when you need to compare different time periods, markets, or channels side by side.
Dashboard-level means one date range and one set of filters apply to everything at once. Change the date or switch the market at the top and every widget updates. Walking a client through last month’s performance in their region? Two clicks and the whole dashboard shifts.
More Control Over Layout
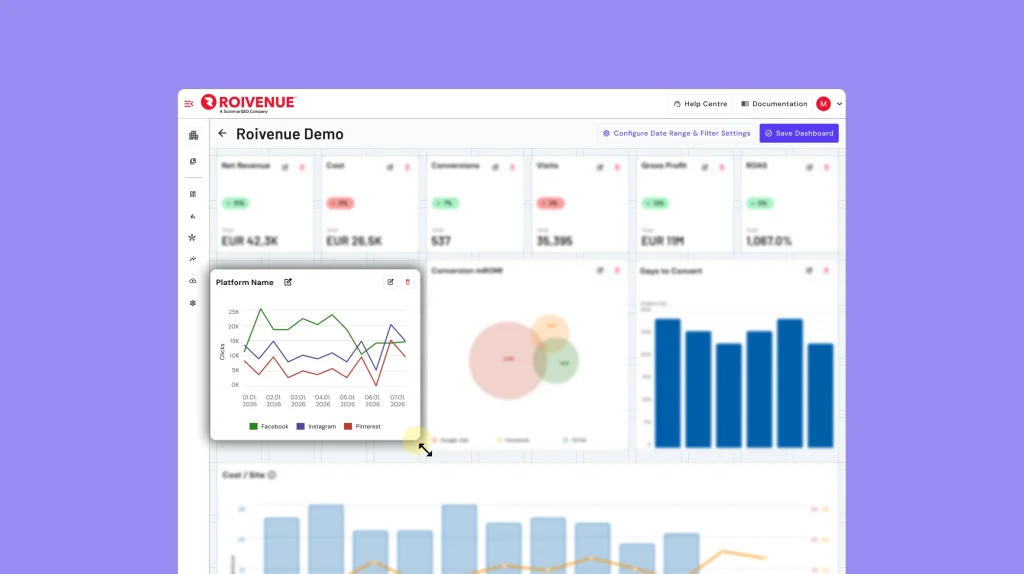
The grid is now more granular and edit mode gives you real freedom. Make your most important metric large and front and center. Put a row of smaller widgets below for a quick channel overview.
The grid is now more granular and edit mode gives you real freedom. Make your most important metric large and front and center. Put a row of smaller widgets below for a quick channel overview. Build the layout around how you actually read the data, not around what the grid forces you into.
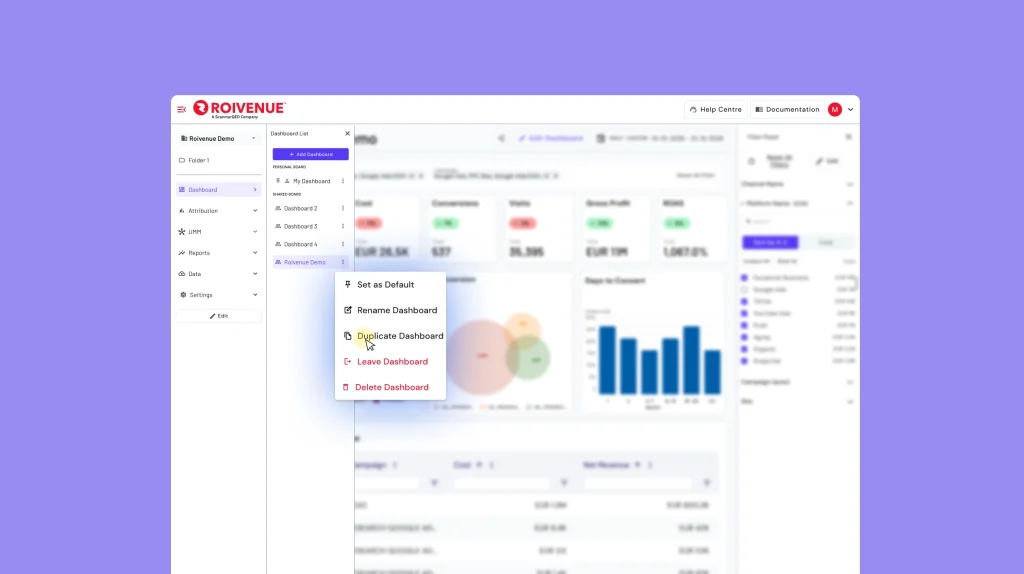
Duplicate Widgets and Dashboards
Now you duplicate the whole dashboard, swap out what’s different, and you’re done. Same goes for individual widgets. If you need a similar view with one thing changed, duplicate and adjust rather than starting over.
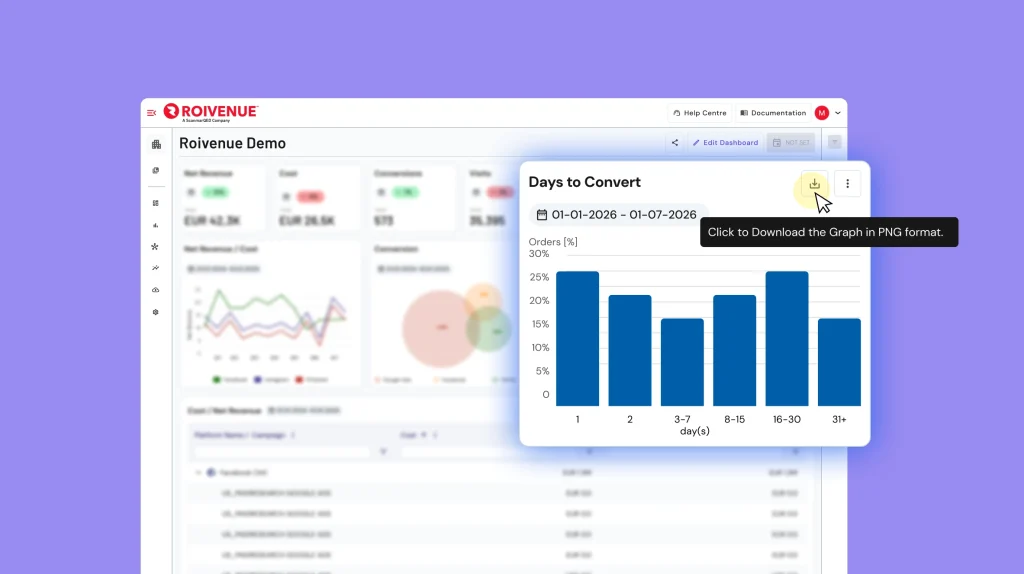
Export Directly From the Widget
Any table or chart can now be exported directly from the widget. Before, getting data out meant navigating to a separate reporting page, recreating the same view, and exporting from there. Now there is a direct export button right on the widget, right where you already are.
And on top of all that, the Dashboard has been fully redesigned. Cleaner layout, more intuitive navigation, and a look that makes it easier to find what matters at a glance.
All of these changes are live now. Open your Dashboard and see for yourself.
Log in and explore the updated Dimensions yourself. And if you’d like a walkthrough, your Customer Success Manager is happy to go through it with you.