


From Impression to Conversion: Analyze Every Conversion Journey with the New Transactions History Page
If you’ve ever wanted to understand how exactly a specific customer came to you, now you can. The new Transactions History page brings those details directly into Roivenue. No need to export raw data or rely on data scientists. You now have everything in one place, ready to explore.
Transaction History gives you a clear view of every single order, along with the full customer journey behind it. You can see what channels were involved, how the user interacted with your ads, and when.
Explore Touchpoint-Level Data Within Each Order Path
Until now, most of your analysis has focused on performance at the platform, campaign, or creative level, and that’s exactly how it should be when optimizing budgets or comparing channels. But sometimes, you need a different kind of insight. One that goes deeper, all the way down to a specific conversion.
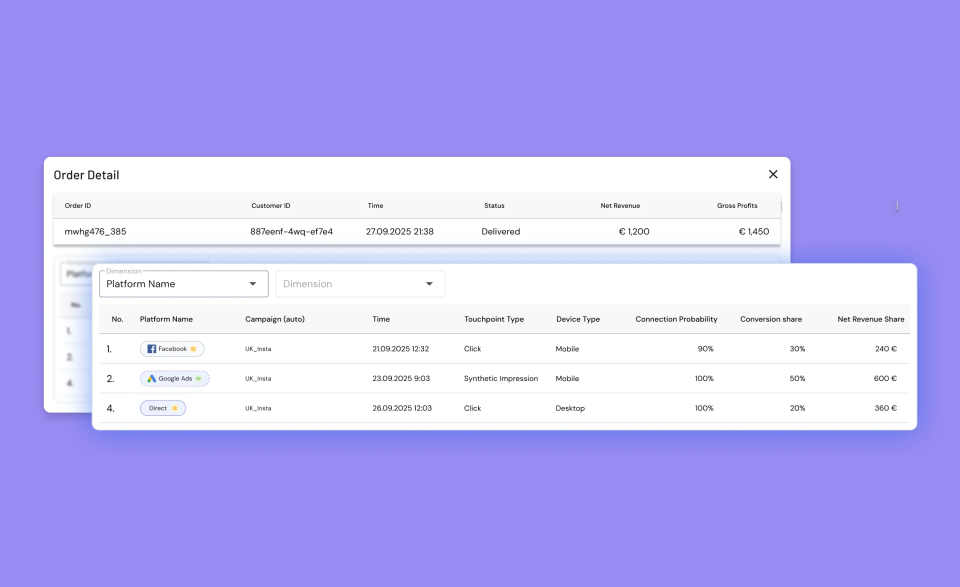
With Transactions History, you can now zoom in on any individual order and see the exact touchpoints that contributed to it, including when they happened, what type of interaction they were (such as a visit or a synthetic impression), and what platform, campaign, or creative they came from. If net revenue is available, you’ll also see how much value was assigned to each touchpoint. This type of detail used to require a custom export and often some extra analysis outside the app. Now it’s right at your fingertips
Imagine a customer places an order worth EUR 1,200. Their journey includes a Meta impression, a click on a Google Search ad, and a direct visit that leads to the purchase. You’ll see how that value is split – for example, 30 percent Meta, 50 percent Google, 20 percent Direct. And if net revenue is available, the share applies directly to the revenue as well.
See How Path Stitching Works in Practice
Roivenue Measurement uses Path Stitching to connect touchpoints that would normally be treated as separate customer journeys. You can now see this stitching directly in the Transactions History page. When you open a specific order, each touchpoint comes with a connection probability. This metric shows how confident the system is that the touchpoint belongs to the same customer journey.
If someone visits your site from a phone, then a laptop, then a tablet, these visits might seem unrelated. But Roivenue compares device setup and browsing patterns to connect them. So if you see a touchpoint with lower probability and a different device category, that likely means cross-device stitching was applied.
This gives you better visibility into how fragmented journeys actually work and how attribution is calculated in complex scenarios.
Take a Different Look at Your Conversions
The Transactions History page gives you a completely new way to view your conversion data. Instead of looking at aggregated performance by campaign or platform, you can focus on individual orders and explore the full journey behind each one.
It’s a practical, transparent view that helps you understand how specific purchases happened, step by step, touchpoint by touchpoint, directly in the Roivenue app.